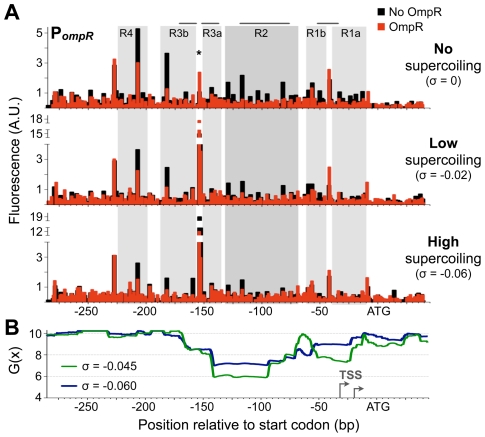
Figure 5. OmpR binding to DNA at different supercoiling levels.
A) Quantification of OmpR binding to PompR in the plasmid pZec-PompR at various supercoiling states using primer extension DNase I footprinting. The size and quantity of 6-FAM-labelled primer extension products were measured using a capillary electrophoresis DNA sequencing instrument. The approximate superhelical density (σ) of DNA in binding reactions is indicated. Horizontal grey lines above the footprints show where Bang et al. [23] observed OmpR footprinting; note that they measured binding to a limited region of the promoter. Grey-filled background highlights OmpR-protected regions, with darker grey highlighting the OmpR-2 site. The asterisk indicates the hypersensitive site at position −154. B) SIDD profile of PompR in pZec-PompR at two superhelical densities. To detect long range effects of DNA supercoiling, WebSIDD [32] uses a default 5 kbp window that slides by 500 bp, thus each base pair is considered 10 times and the G(x) is calculated by weighting the effects of proximal bases. G(x) is expressed in kcal/mol/bp. Grey arrows indicate transcription start sites (TSS), mapped in [23].

