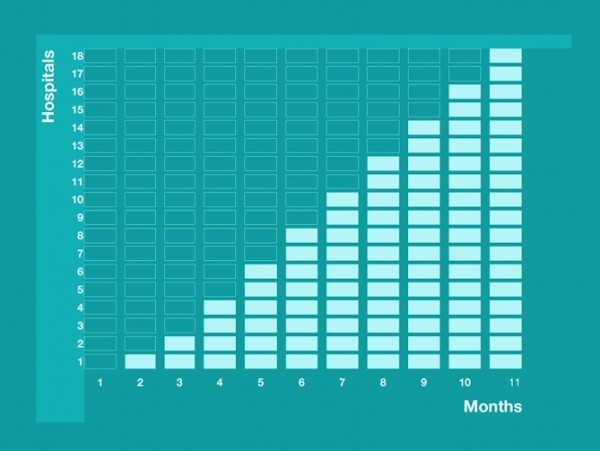
Figure 1.

Diagrammatic illustration of the stepped wedge design. Each cell represents a moment of data gathering. The dark blue cells represent data gathering in hospitals without e-learning (control period). The light blue cells represent data gathering in hospitals with e-learning (intervention period).
