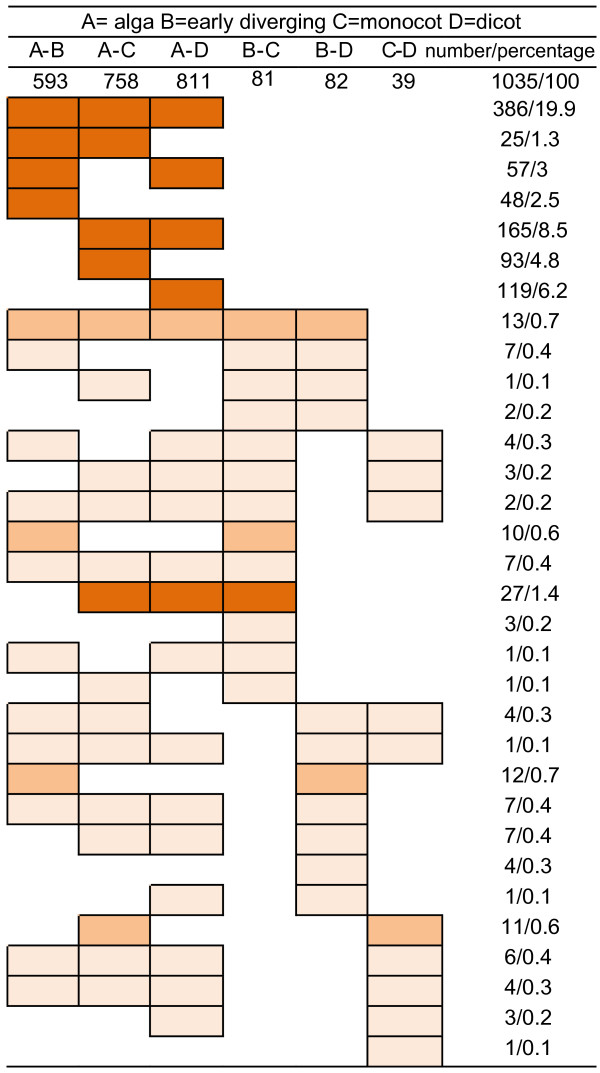
Figure 3.
Lineage-wise architecture expansion in plants. Pairwise comparisons of genomic dosages of architectures were made between lineages and colored boxes represent the significant expansion of architectures. Patterns of more than 25 counts of architectures are shown in red and less than 25 in light orange. The numbers denotes the counts and percentages of architectures of each pattern that have undergone significant expansion. Only the patterns that have an incidence higher than 1% are shown.

