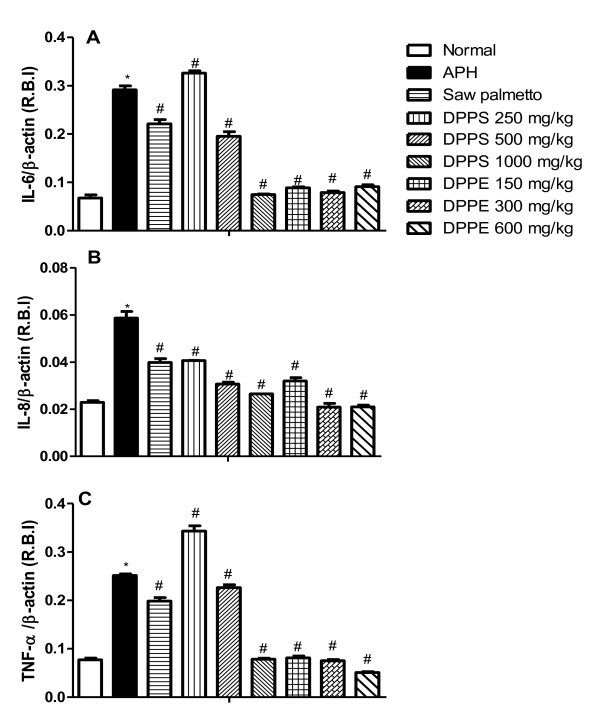
Figure 1.
The expression of IL-6, IL-8 and TNF-α target genes in ventral prostate of Wistar rats after treatment with DPPS and DPPE. All values are expressed as mean ± S.E. of the relative band intensity (R.B.I.) using β-actin as a reference. *Significantly different from normal control rats at P < 0.05. # Significantly different from APH control rats received CMC at P < 0.05.

