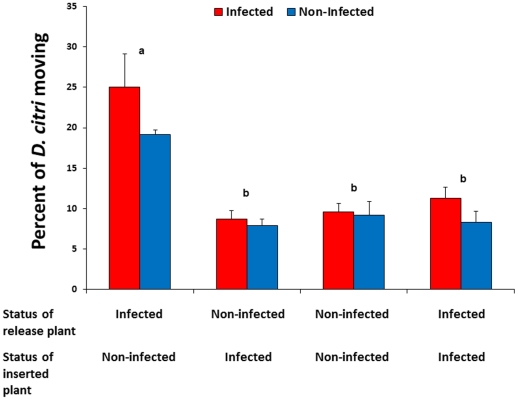
Figure 3. Movement of previously settled D. citri from Las-infected to non-infected citrus plants.
Red bars show the response of Las-infected psyllids and blue bars show the response of non-infected psyllids; no significant differences were detected between psyllid types within plant treatments. Pairs of bars representing plant treatment combinations labeled with different letters are significantly different from one another (Tukey's HSD test, p<0.05).

