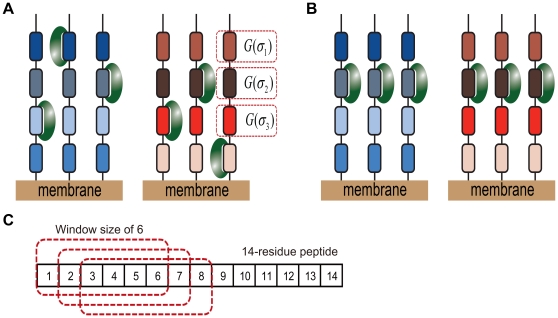
Figure 2. Two different binding models for SH3 complexes.
(a) A graphical representation of the MS model, wherein short peptides with the same sequence were synthesized on a small region of membrane and SH3 domains are assumed to bind at various sites on the peptides. G(σi) denotes the binding free energy of the ith binding site. An SH3 domain may bind at multiple sites on a single peptide, but temporally, one site per peptide due to the SH3 domain size; each site is in dynamic equilibrium with a different binding free energy. (b) A graphical representation of the SS model, which assumes that the SH3 domain binds at the same position on the peptides according to the alignment used in the SPOT experiment. (c) An example of multiple binding sites with a window size of 6 is illustrated for a 14-residue peptide, where the red squares with a dotted line denote individual binding sites and correspond to the individual binding sequences, σi in Eq. 9.

