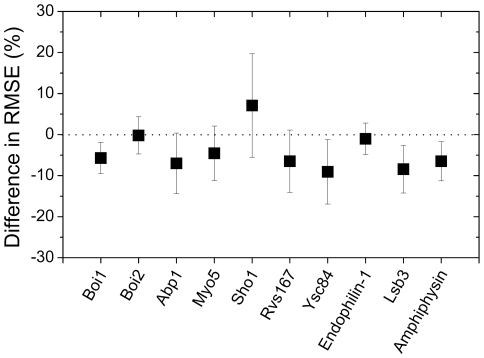
Figure 4. The prediction error difference between the MS model and the SS model.
The differences in the prediction errors are plotted as squares, where a negative value denotes better performance of the MS model. The error bars denote the standard deviations of the differences for each SH3 domain. In this figure, the difference in prediction errors was measured by the following methods: the lowest prediction error was selected for each computational model, and the difference between the selected prediction errors from the models was evaluated for 10 training/test sets.

