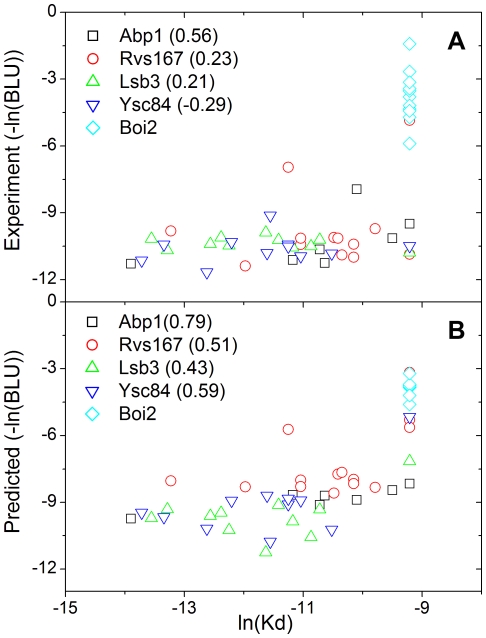
Figure 5. The MS model provides a better correlation with the dissociation constants than the prediction using the SPOT intensities.
The predicted values for the SPOT intensities correlate better with the dissociation constants. (a) The experimental SPOT intensities were plotted according to their dissociation constants, and (b) their predicted SPOT intensities were plotted. The Pearson's correlation coefficient for each SH3 domain is in parentheses. The value for Boi2 is not provided because the dissociation constants are fixed due to experimental limitation.

