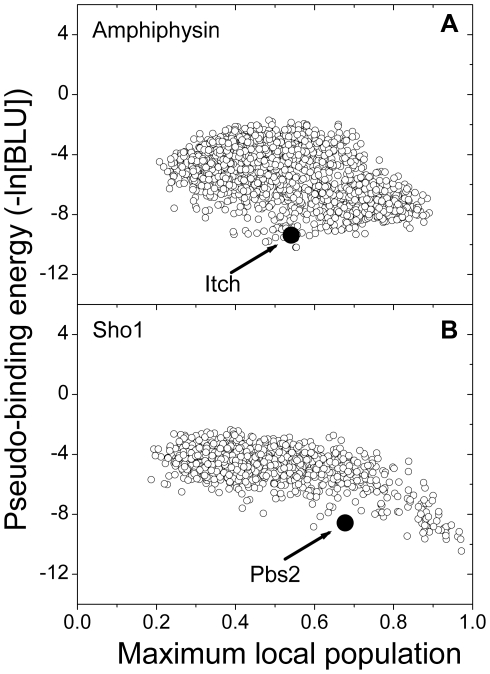
Figure 6. The maximum local populations for representative SH3 domains are shown.
The predicted pseudo-binding energies are plotted based on the MLPs. (a) The MLP data for amphiphysin are shown. The maximum binding affinity data for amphiphysin fall within the middle region of the MLP. A solid circle marks the peptide (PSRPPRPSR) from the Itch protein that has two possible binding sites. (b) The MLP data for Sho1 are shown. The fully localized interaction for Sho1 has the maximum binding affinity. A solid circle marks the peptide (NKPLPPLPVAGSSKV) from the Pbs2 protein, which is a well-known binding partner of Sho1.

