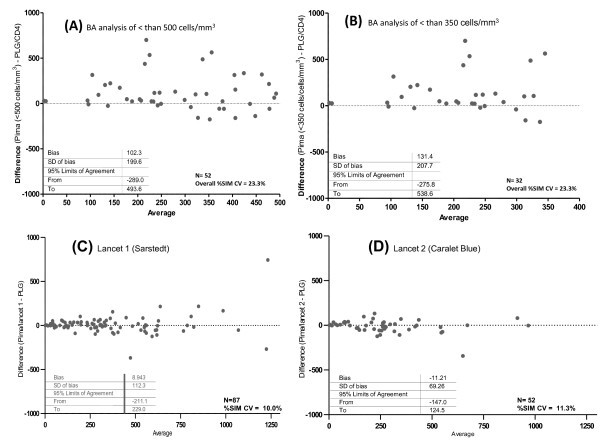
Figure 4.

Field testing of Pima™. Figure to show Bland-Altman analysis of Pima™ performance during field testing. In Phase IIIA, comparison of Pima™ CD4 versus predicate is shown in a rural PHC HCT clinic (N = 96) where (A) includes samples of < 500 cells/mm3 and (B) samples of < 350 cells/mm3. In Phase IIIB, comparison of Pima™ CD4 versus predicate is shown in an inner-city PHC HCT clinic (N = 139), revealing acceptable performance irrespective of whether (C), lancet 1 (N = 87) or (D) lancet 2 (N = 52) was used. Bland-Altman values shown above are in cells/mm3.
