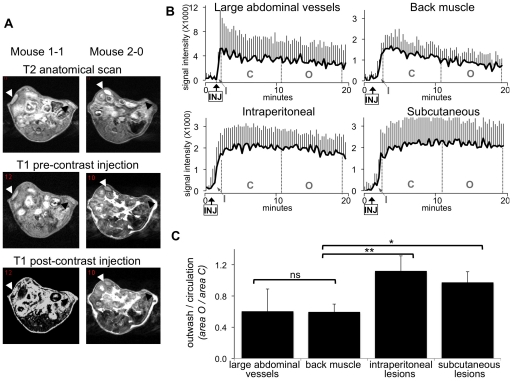
Figure 4. Endometriosis visualised by gadofosveset-trisodium enhanced MRI.
Three weeks after lesion induction, mice were subjected to gadofosveset-trisodium enhanced MRI. A. Examples of T2 weighted anatomical images and T1 weighted prior and post contrast injection in two mice. Lesions are indicated by black arrow-heads (subcutaneous) and white arrow-heads (intraperitoneal). B. DCE-MRI derived intensity time-curves in the large abdominal blood vessels, back muscle, intraperitoneal and subcutaneous lesions. Injection of gadofosveset-trisodium is indicated (arrow-INJ). The inwash (I), circulation (C) and the outwash phases (O) of the contrast agent are indicated. Charts represent the average signal intensity of nine mice plus SD. C. The ratio O/C was assessed in the large abdominal vessels, back muscle and endometriosis. Statistic based on unpaired Wilcoxon test: * = 0.001; **<0.001; ns = non-significant.

