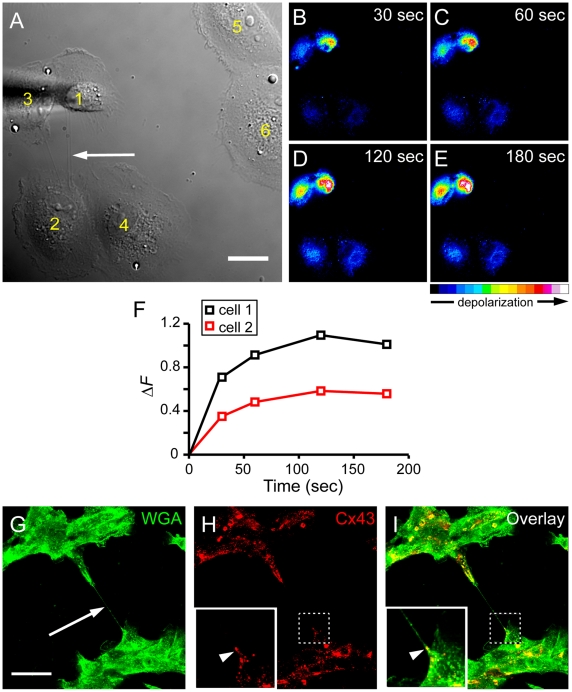
Figure 8. Depolarisation signals spread between TNT-connected ARPE-19 cells.
(A) The DIC image shows the mechanically stimulated cell (cell 1), TNT-connected cell (cell 2), TNTs (arrow) and control cells (cell 5 and 6). Scale bar, 20 µm. (B-E) The pseudo-coloured intensity images, generated by subtraction of the image before stimulation, show DiBAC4(3) fluorescence increase of cells in (A) at indicated times after mechanical stimulation. Note that the close associated cells pairs (cell 1 and 3, cell 2 and 4) are also electrically coupled. Colour bar indicates relative level of depolarisation. (F) Quantification of the relative membrane potential changes ( ΔF) of the stimulated cell (cell 1) and the TNT-connected cell (cell 2) as shown in (B-E). (G-I) The presence of Cx43 on TNTs in ARPE-19 cells. Cells were fluorescently labelled using WGA (green; G, I) and anti-Cx43 (red; H, I) and imaged by confocal microscopy. The enlarged images show distinct signals of Cx43 immunolabelling (arrowheads) at one end of a TNT (arrow). Scale bar, 50 µm.

