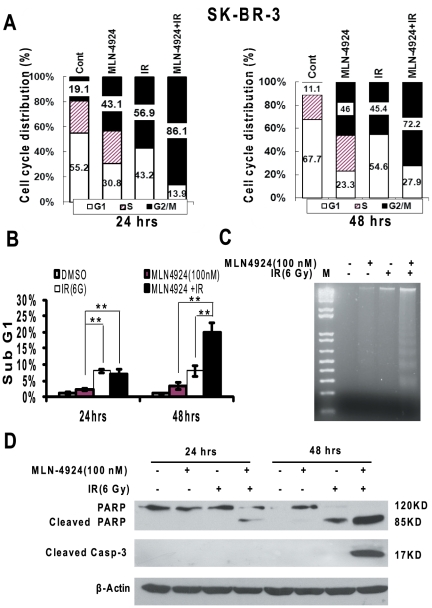
Figure 2. MLN4924 alters cell cycle profile and induces apoptosis.
SK-BR-3 cells were treated with MLN4924 at 100 nM for 24 hrs or 48 hrs (A&B), alone or in combination with radiation (6 Gy), followed by FACS analysis for cell cycle profile (A), sub-G1 population for apoptosis (B), DNA fragmentation (48 hrs treatment) (C) and Western blotting with indicated antibodies (D). Shown is mean (A) or mean ± SEM (B), (n = 3): **, p<0.01. One representative result is shown.

