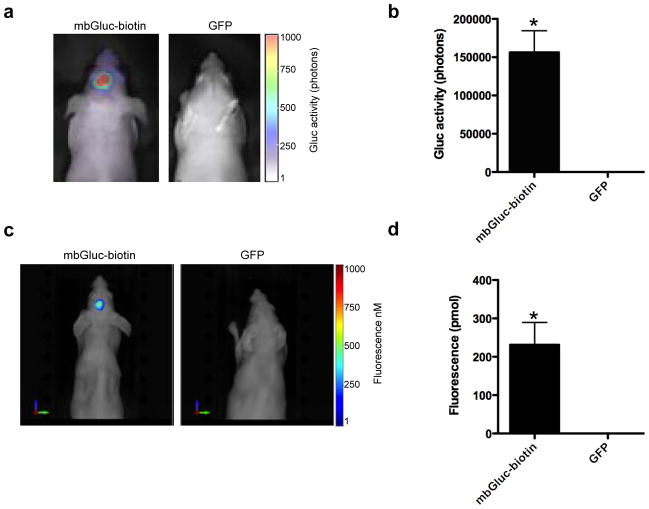
Figure 3. Optical imaging of mice bearing intracranial tumors.
Gli36 cells expressing either mbGluc-biotin or GFP control (n=5/group) were implanted intracranially in nude mice. (a) Three weeks later, mice were i.v. injected with coelenterazine and imaged by bioluminescence using a cooled CCD camera. (b) Quantification of tumor-associated bioluminescence signal in (a). (c) The same mice from (a) were i.v. injected with streptavadin-Alexa750 conjugate and imaged twenty-four hours later with fluorescence-mediated tomography (FMT). (d) Quantification of tumor associated fluorochrome levels in (c). A representative mouse from each group is shown in (a) and (c). Data shown in (b) and (d) as mean ± SD (n=5; *p<0.001 as calculated by student’s t-test).

