
Figure 1. Affinity purification of HIV-1 proteins, analysis and scoring of mass spectrometry data.
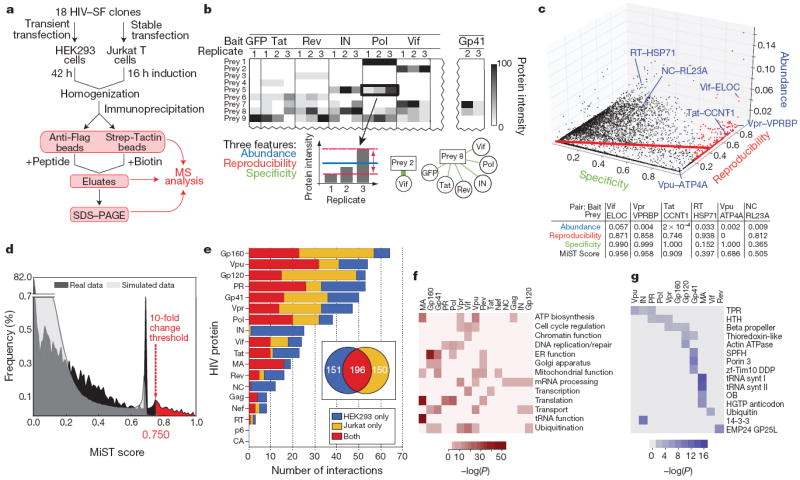
a, Flowchart of the proteomic AP–MS used to define the HIV–host interactome. PAGE, polyacrylamide gel electrophoresis. SF, 2×Strep–3×Flag affinity tag. b, Data from AP–MS experiments are organized in an interaction table with cells representing amount of prey protein purified (for example spectral counts or peptide intensities). Three features are used to describe bait–prey relationships: abundance (blue), reproducibility (the invariability of bait–prey pair quantities; red) and specificity (green). c, All bait–prey pairs are mapped into the three-feature space (abundance, reproducibility and specificity). The MiST score is defined as a projection on the first principal component (red line). All interactions, represented as nodes, above the defined threshold (0.75) are shown in red. This procedure separates the interactions more likely to be biologically relevant (for example Vif–ELOC (ELOC also known as TCEB1), Vpr–VPRBP and Tat–CCNT1) from the interactions that are likely to be less relevant owing to low reproducibility (Vpu–ATP4A) or specificity (RT–HSP71 (HSP71 also known as HSPA1A) and NC–RL23A (RL23A also known as RPL23A)). d, The histogram of MiST scores (real data) is compared with a randomized set of scores obtained from randomly shuffling the bait–prey table (simulated data). The MiST score threshold (0.75) was defined using a benchmark (Supplementary Table 3) whereby the predictions are enriched for these interactions by a factor of at least ten relative to random predictions (as well as through ROC (receiver operating characteristic) and recall plots (Supplementary Fig. 6)). e, Bar graph of the number of host proteins we found interacting with each HIV factor (MiST score, >0.75). The cell type in which the interaction was found is represented in blue (HEK293 only), yellow (Jurkat only) or red (both). f, g, Heat maps representing enriched biological functions (f) and domains (g) from the human proteins identified as interacting with HIV proteins (Supplementary Methods). ER, endoplasmic reticulum; mRNA, messenger RNA; tRNA, transfer RNA. TPR, tetratricopeptide repeat; HTH, helix-turn-helix; SPFH, stomatin–prohibitin–flotillin–HflK/C.