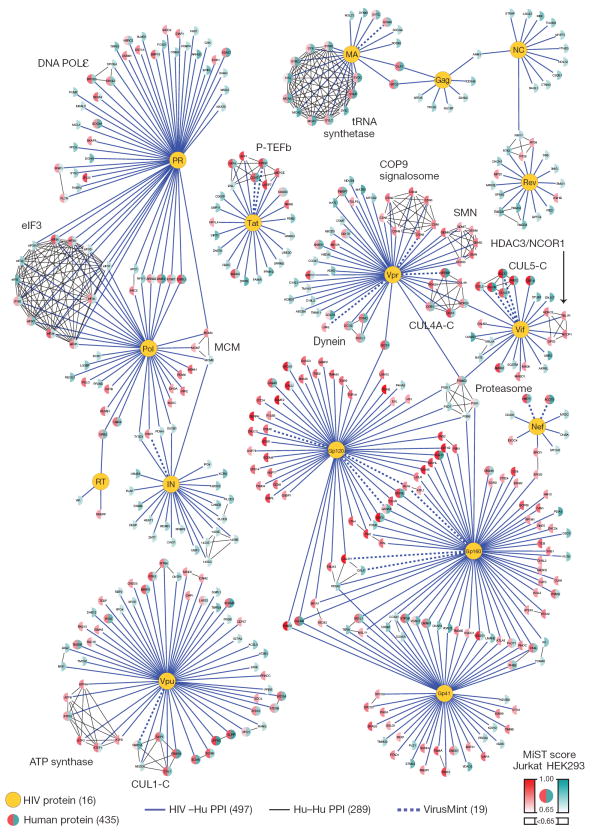
Figure 3. Network representation of the HIV–human PPIs.
In total, 497 HIV–human interactions (blue) are represented between 16 HIV proteins and 435 human factors. Each node representing a human protein is split into two colours and the intensity of each colour corresponds to the MiST score from interactions derived from HEK293 (blue) or Jurkat (red) cells. Black edges correspond to interactions between host factors (289) that were obtained from publicly available databases; dashed edges correspond to interactions also found in VirusMint14.

