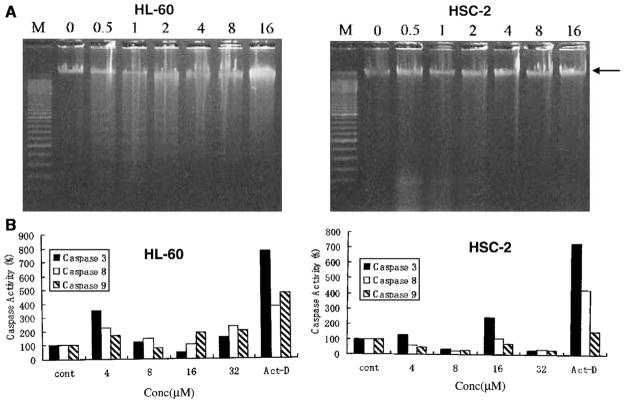
Figure 3.
(A) Evaluation of the effects of 1e in HL-60 and HSC-2 cells (5 × 10⁵ cells) on DNA fragmentation after incubation for 6 h with the concentration indicated (in μM). M is the molecular weight marker of DNA. The arrow indicates a large DNA fragment. Reproducible results were obtained when repeating the experiment. (B) The effect of 1e on the activation of caspases in neoplastic cells (4 × 10⁴ cells) after incubation for 4 h. Each value is the mean of two or three experiments.

