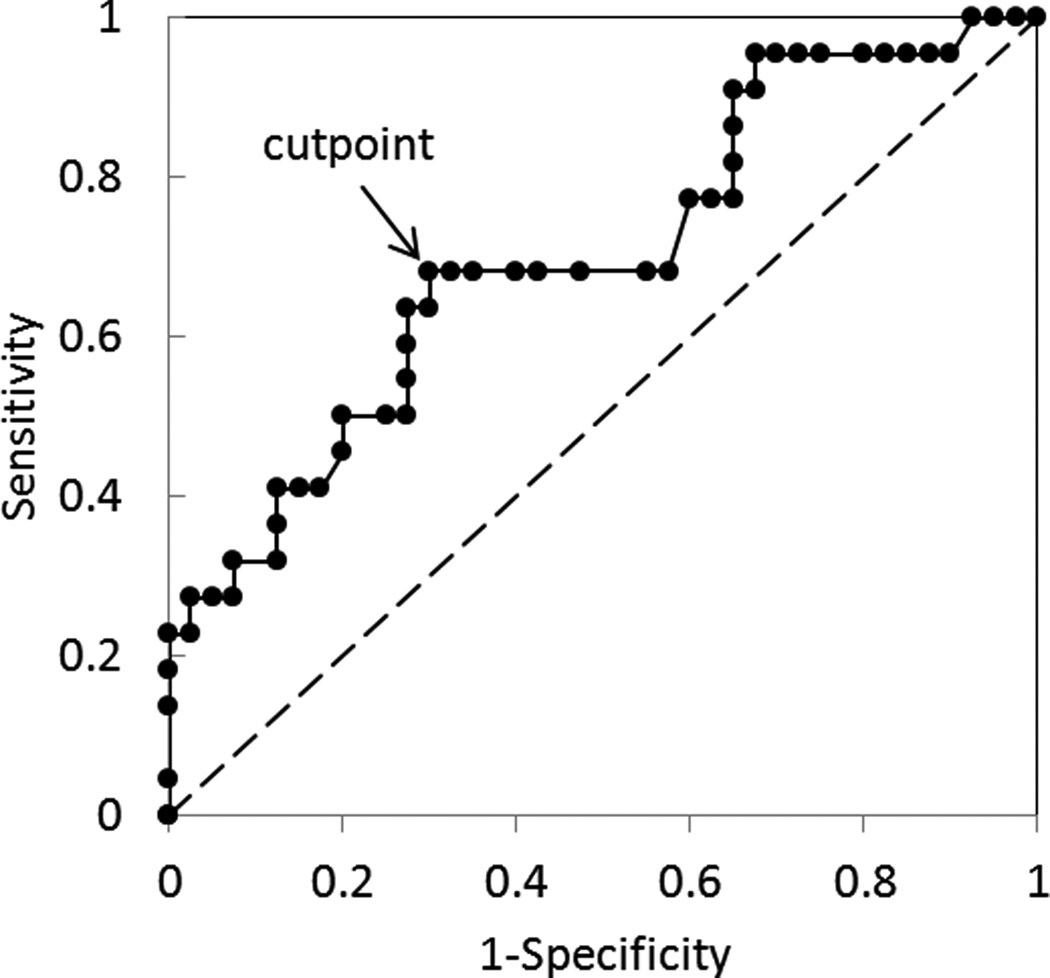
Figure 8.
ROC curve of Δve at baseline examination in discriminating between EFS and non-EFS patients. Area under curve is equal to 0.70 with a sensitivity (True Positive Rate) of 0.68 and a specificity (1- False Postive Rate) of 0.7 at the optimal cutpoint of Δve=0.032. Similarly, the median value of Δve=0.026 in Figure 7b corresponds to a sensitivity of 0.68 and a specificity of 0.65.

