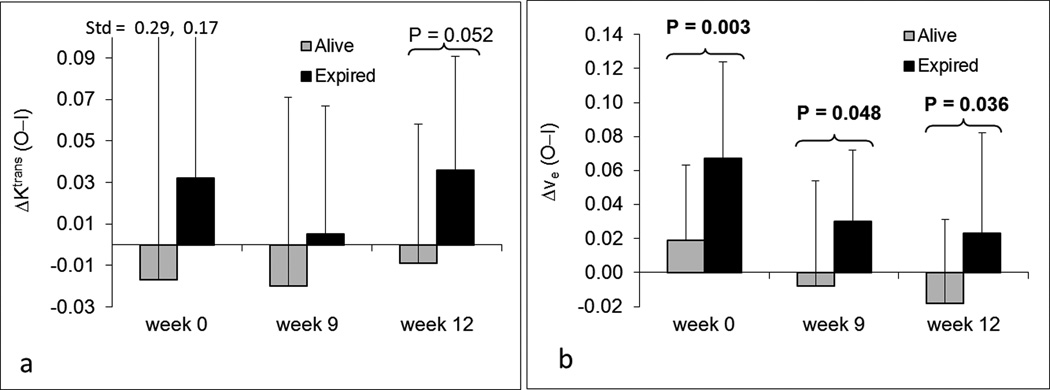
Figure 9.
Bar plots of DCE-MRI parameters ΔKtrans (a) and Δve (b) at three time points for patient survival status. P-values less than 0.1 are displayed at the corresponding time points. Lighter gray bars represent patients alive at the time of analysis; Dark bars represent dead patients. Std represents standard deviation.

