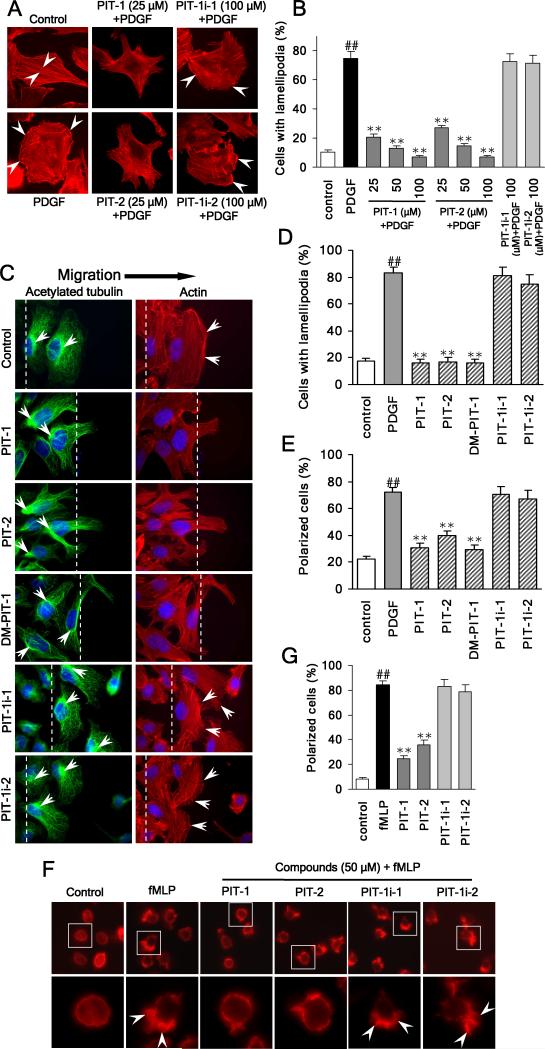
Figure 2. PIT-1 inhibits lamellipodia formation and cell polarization.
(A) PITs inhibit lamellipodia formation in cancer cells. SUM159 cells were serum starved and treated with compounds for 2 hr, followed by PDGF (100 ng/ml) stimulation for 15 min. Then cells were stained and analyzed using fluorescent microscopy. The representative fluorescent images are shown (A, the stress fibers and lamellipodia are indicated by arrowheads). The number of cells with significant lamellipodia was counted randomly in five fields and the percentage was calculated (B).
(C-E) PITs inhibit cell polarization and lamellipodia formation. Wounds were generated in SUM159 cell monolayers. Then SUM159 cells were serum starved and treated with compounds for 2 hr, followed by stimulation with 100 ng/ml PDGF for 15 min. Then cells were fixed and stained with TRITC-phalloidin for F-actin (red), acetylated tubulin antibody (green) for microtubule organization center (MTOC), and Hoechst for nuclei (blue). Cell polarization was evaluated by analyzing the relative location of the MTOC and nuclei. The cell was considered polarized if MTOC was observed to the wound side of the nuclei. The representative fluorescent images are shown (C, The wound edge is indicated with white lines and the actin ruffles and the MTOC are marked with white arrowheads). The number of polarized cells (E), as well as cells with significant lamellipodia (D) was counted in five random fields under a fluorescent microscope and the percentage was calculated.
(F,G) PITs inhibit fMLP stimulated HL-60 cell polarization. Differentiated HL-60 cells were treated with compounds at indicated concentrations for 2 hr, followed by stimulation with 100 nM fMLP for 3 min. Actin was stained and analyzed using fluorescent microscopy. The representative fluorescent images are shown (F, the leading edge of the polarized cells with lamellipodia is indicated by arrowheads). The number of polarized cells (there is obvious leading edge with lamellipodia) was counted randomly in five fields and the percentage was calculated (G).
##P<0.01 compared with control group, **P<0.01 compared with PDGF/fMLP group.

