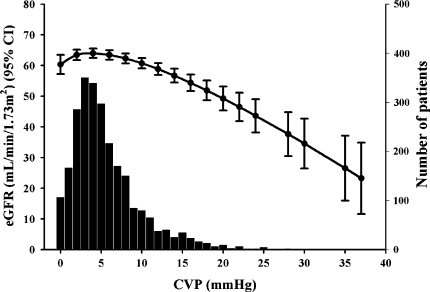
Fig. 1.
Distribution of central venous pressure and curvilinear relationship between central venous pressure and estimated glomerular filtration rate in 2557 patients that underwent right heart catheterization at the uMCG between 1989 and 2006. Curve is adjusted for age, gender, and cardiac index. (from: Damman et al. ref 15)

