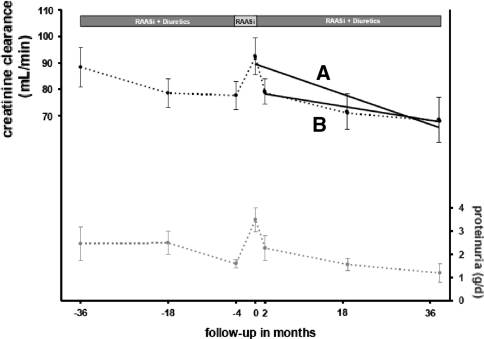
Fig. 3.
Graph illustrating the reversibility of diuretic-induced decrease in renal function (creatinine clearance, left Y-axis) and the long-term rate of renal function in renal patients on RAAS blockade (RAASi): dotted lines. At time point −4, diuretic treatment is withdrawn, with continuation of the RAASi. This results in a rise in renal function, demonstrating the volume dependency of renal function during RAASi, and its reversibility. At re-institution, necessitated by the concomitant rise in proteinuria (lower dotted line), creatinine clearance decreases again, with a concurrent decrease in proteinuria. The drawn lines A and B represent estimation of rate of long-term renal function loss, without and with taking into consideration the reversible impact of the change in volume status by the diuretic. (from: Slagman et al. ref 34)

