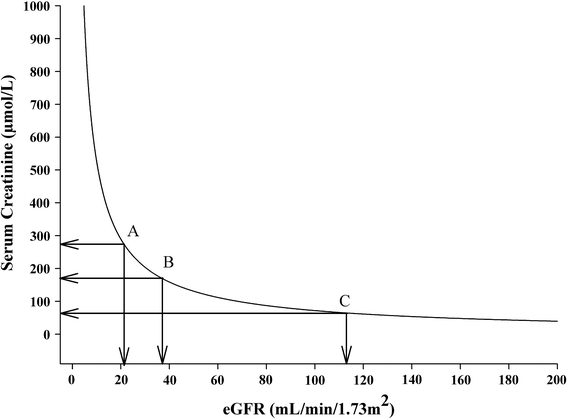
Fig. 1.

Relationship between serum creatinine and estimated GFR: effect of change in serum creatinine. Different changes in estimated GFR with similar changes in serum creatinine. A pronounced decrease in GFR from normal—the flat part of the curve—gives just a subtle increase in serum creatinine that often stays within the normal day-to-day variability of the assay and, therefore, may go unnoticed. The other way round, a trivial further decrease in already compromised GFR leads to a steep rise of creatinine, based on the steepness of the curve here, that can lead to undue concern. For example, a decrease in serum creatinine from point A to B results in a decrease in eGFR of 15 ml/min/1.73 m2. However, a decrease in serum creatinine from point B to C results in a much more pronounced decrease in eGFR of 75 ml/min/1.73 m2. Depicted is the GFR estimated by the simplified MDRD for a 70-year-old white male
