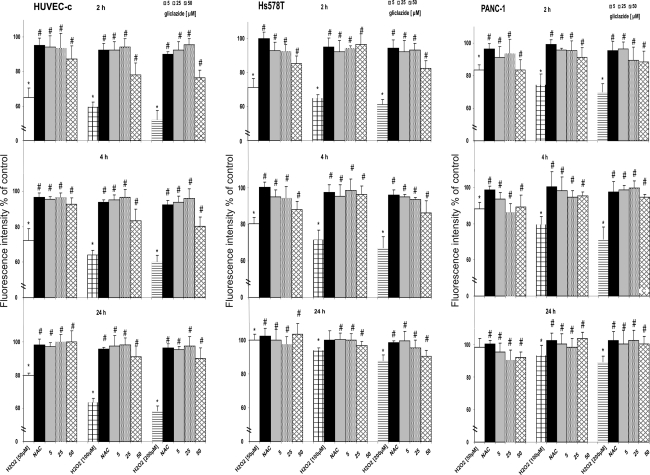
Fig. 4.
Changes in mitochondrial membrane potential (ΔΨm) of HUVEC-c, Hs578T and PANC-1 cells seeded into black 96-well titration microplates in the presence and absence of antioxidant-NAC or gliclazide, The cells were treated with different H2O2 concentrations for 2, 4 or 24 h. In experiments with antioxidant or gliclazide, cells were preincubated with 3 mM NAC or 5–50 μM gliclazide for 1 h, then H2O2 was added and incubation was continued for another 2, 4 or 24 h. ΔΨm was estimated with a fluorescence dye JC-1 at the end of incubation directly in the cell monolayers. Fluorescence ratio of JC-1 dimers/JC-1 monomers of control was assumed as 100%, The results represent mean ± SD of four independent experiments. *P < 0.05 in comparison to respective control cells taken as 100%. # P < 0.05 indicates significant differences between H2O2-treated cells and samples preincubated with NAC or gliclazide

