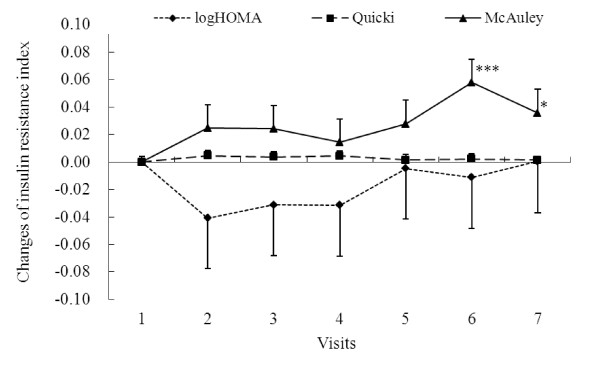
Figure 2.
Changes of logHOMA, Quicki and McAuley index, the insulin resistance indicators throughout the study period. 42 subjects were supplemented with 4.8 g/d wild bitter gourd for three month. Insulin resistance index was monitored monthly during the three-month supplementation (visit 1-4) and another three months (visit 5-7) after the supplementation ceased. Values are means and error bars are 1/2 SEM. *p = 0.043 and ***p = 0.001 denote significantly different from the baseline value (visit 1) analyzed by linear mixed models after adjusting for age and sex.

