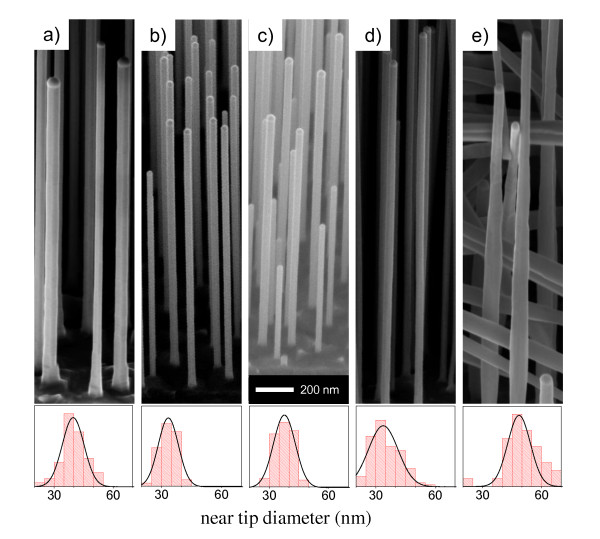
Figure 1.
(Samples a, b, c, d, and e) 45° tilted SEM image of the investigated InAs nanowires. They were 1 to 2 μm long and grown with DtBSe precursor line pressures of (a) 0 Torr; (b) 0.05 Torr; (c) 0.1 Torr; (d) 0.2 Torr; and (e) 0.4 Torr. The bottom panels show the histograms representing the as-grown nanowire near-tip diameter distribution of the corresponding NW samples. The solid line is a Gaussian fit of the distribution.

