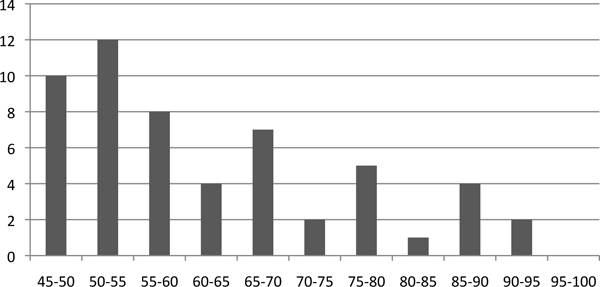
Figure 1.
The sequence similarity histogram of homologous tRNAs in the human and mouse genomes. The X-axis is the sequence similarity. The Y-axis is the number of homologous tRNA pairs. The sequences are obtained from the tRNA family in the Rfam [8] database. For each human tRNA, we report the highest sequence similarity.

