
Figure 2.
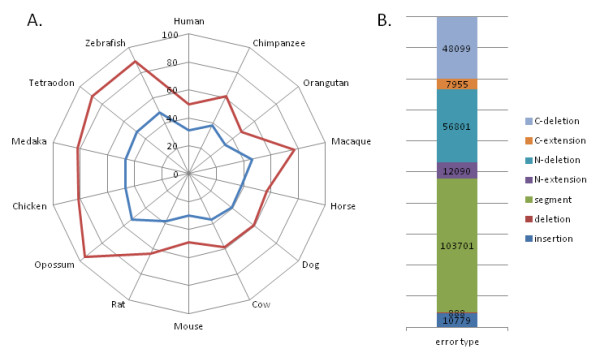
Estimation of sequence error rates. A) Percentage of predicted sequence errors in 19,778 protein families in 14 vertebrate genomes. In blue, the percentage of sequences with at least one error. In red, the percentage of total errors observed. B) Classification of sequence errors into 7 types according to their position in the sequence and their nature (see methods). The histogram shows the frequencies of each error type observed in all protein sequences (C-deletion = C-terminal deletion; C-extension = C-terminal extension; N-deletion = N-terminal deletion; N-extension = N-terminal extension; segment = suspicious sequence segment: deletion = internal deletion; insertion = internal insertion).