
FIGURE 6. Refolding of the N-subdomain during the transition to an EC.
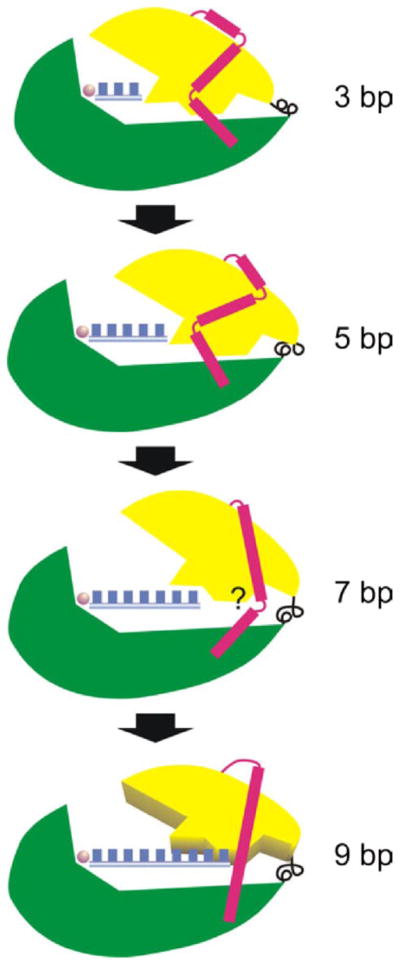
The schematic depicts the movement of the core subdomain (yellow) and refolding of the N-terminal subdomain (red) relative to the C-terminal domain (green) as the transcript length increases from 3 to 9 bp (blue boxes). The C-linker is black. Up to −5 bp movement of the core is apparently tolerated without a need to refold the N-subdomain. A transition at about 6 –7 bp appears to require refolding of at least some parts of the N-subdomain (e.g. the region associated with residues 45–55). Additional movement of the core is expected to occur up to promoter release (commencing at 9 bp) and the final transition to an EC.