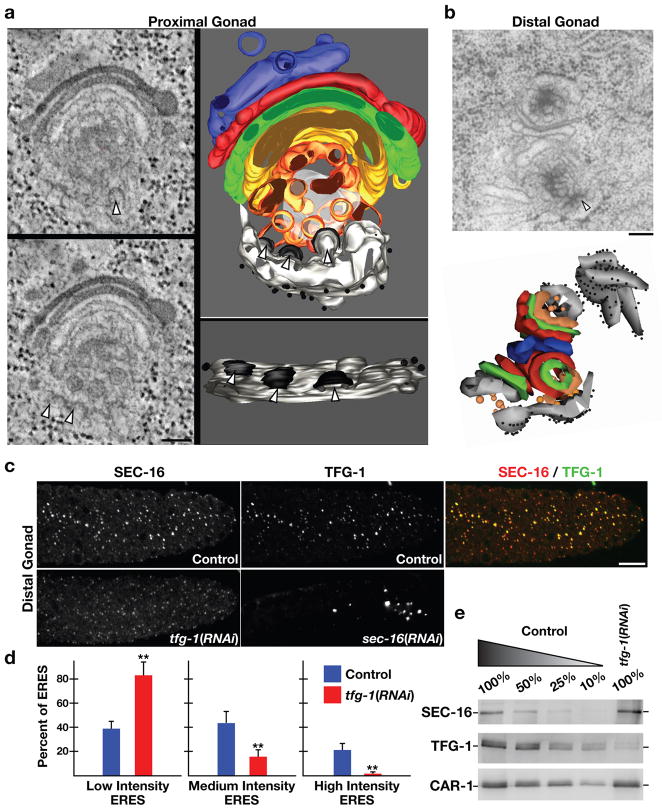
Figure 3. TFG-1 regulates SEC-16 levels on ER exit sites.
(a) In the proximal gonad, a 300 nm section of the early secretory pathway (ER exit sites, ERGIC, and Golgi) was analyzed by electron tomography. ER exit sites are highlighted by arrowheads. On the left are individual sections from the tomographic stack. On the right are two orthogonal views of the tomogram following three-dimensional reconstruction. Light grey: ER; black: COPII coat; orange and yellow: ER-derived transport vesicles and ERGIC; green, red, blue: Golgi cisternae; diffuse grey: not further resolvable matrix. Bar, 100 nm. (b) An electron micrograph illustrating ER exit sites and adjacent Golgi complexes in the distal gonad following high pressure freezing and freeze substitution. An arrowhead highlights the presence of budding vesicle from smooth ER (Bar, 100 nm). Below is a three-dimensional construction of the same Golgi complexes and associated ER exit sites. (c) Dissected gonads from control, TFG-1 depleted, and SEC-16 depleted animals were fixed and stained using Cy2-labeled α-TFG-1 and Cy3-labeled α-SEC-16 antibodies. Individual and merged images of the distal gonad with TFG-1 in green and SEC-16 in red are shown (Bar, 10 μm). (d) Fluorescence intensity of SEC-16 in the distal gonad was measured in control and TFG-1 depleted animals, and intensities were segregated into low, medium and high thresholds. To establish individual thresholds, a histogram of fluorescence intensities was equally divided into three regions, and the number of ER exit sites within each area was calculated. The bar graph indicates the percentage of all ER exit sites that fall into a specific threshold. For each condition, at least 1000 unique ER exit sites were examined. Error bars represent mean +/− SEM; 10 different animals. **p < 0.01 compared with control, calculated using a paired t test. (e) Western blots of extracts prepared from animals depleted of TFG-1 by RNAi (n=3). Serial dilutions of extracts prepared from control animals were loaded to quantify depletion levels. Blotting with α-CAR-1 antibodies was performed to control loading.

