Fig. 1.
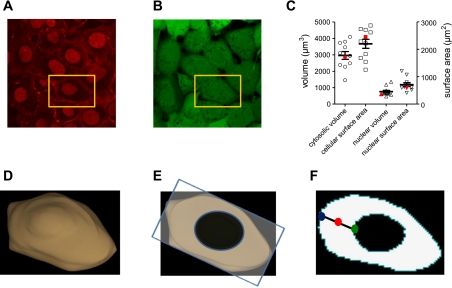
Geometry of cultured pulmonary microvascular endothelial cells (PMVECs). Geometries were based on measurements of a series of slices (z-stacks, confocal microscopy). A: wheat agglutinin Alexa Fluor 647 and DRAQ5 were used to label plasma membranes and nuclei of confluent PMVEC monolayers. B: calcein green was used to label the intracellular space. C: the distribution of dimensions for individual PMVECs. Cytosolic volume was estimated as the intracellular volume minus the nuclear volume. D: three-dimensional geometry of the cultured PMVEC used in subsequent simulations (cell indicated by gold rectangle in A). This cell had average volume, surface area, nuclear volume, and nuclear surface area (indicated in red symbols in C). E: an individual slice through this cell from which results of subsequent simulations are displayed. All simulations were run in three dimensions. F: to simplify the representation of four-dimensional data, we present the time course of cAMP signals at three distinct subcellular locations within the plane depicted in E: at the plasma membrane, within the cytosol, and in the perinuclear space, indicated by the blue, red, and green circles, respectively.

