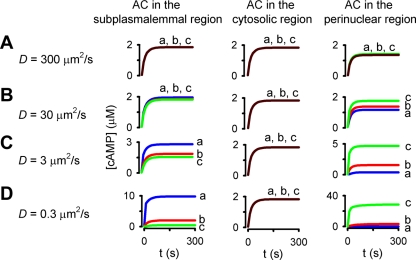
Fig. 8.
Simulations depicting the effects of subcellular AC distribution on spatial spread of cAMP signals. The time course of agonist-induced cAMP accumulation at three subcellular locations, the plasma membrane (blue line, a), the cytosol (red line, b), and the perinuclear region (green line, c), as depicted in Fig. 1F, is shown. In these simulations, AC activity was uniformly distributed along the plasma membrane, within the cytosol, or in the perinuclear region (left, center, and right columns, respectively); PDE activity was distributed uniformly in the cytosol; and the effective cAMP diffusion coefficient was 300, 30, 3, and 0.3 μm2/s (A, B, C, and D, respectively). Decreasing the effective cAMP diffusion coefficient D from 300 to 0.3 μm2/s facilitated the formation of cAMP gradients when AC activity was located at the plasma membrane or in the perinuclear region.

