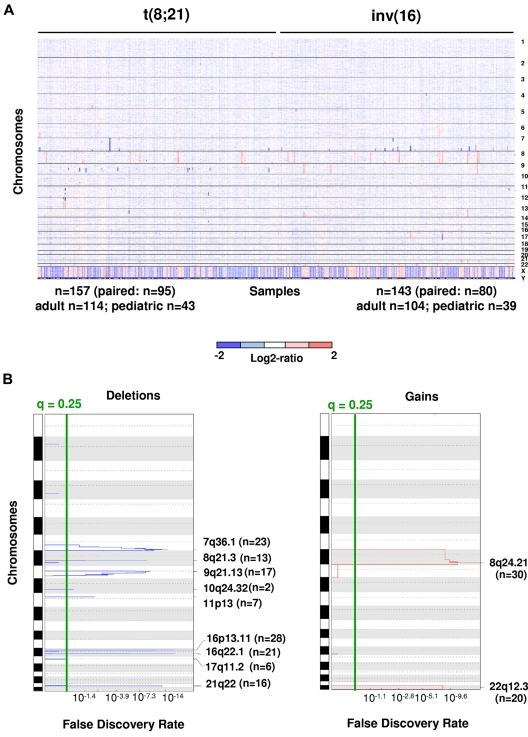
Figure 1.
DNA CNAs in 300 newly diagnosed adult and pediatric patients with CBF-AML. (A) Log2 ratio SNP copy number data of diagnostic leukemia cells (median-smoothed with a window of 5 markers; blue indicates deletion and red gain). Each column represents a case, and the SNPs are arranged in rows according to chromosomal location. Cases are arranged by subgroup. Gross changes can be observed for example in chromosome 8 (17 cases with trisomy 8). (B) Analysis via GISTIC of copy number losses (left) and gains (right). False-discovery rate q values are plotted along the x-axis with chromosomal position along the y-axis. Altered regions with significance levels exceeding 0.25 (marked by vertical green line) were deemed significant. Nine significant regions of deletion, and 2 significant regions of amplification were identified. Chromosomal positions are shown for each significant region on the right side of the plots.

