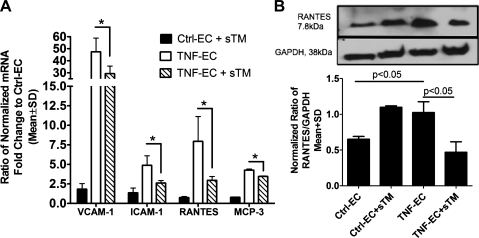
Fig. 7.
Normalization proinflammatory molecules in sTM-treated TNF endothelial cells. A: quantitative real-time PCR analysis of inflammatory gene transcripts in control (Ctrl-EC) and activated endothelial cells (TNF-EC) without and with sTM treatment was determined. Data are shown as normalized mRNA fold-change to control cells. B: Western blot analysis for RANTES. Immunoblot analysis was performed as described in materials and methods with anti-RANTES antibody, stripped, and reprobed with GAPDH antibodies. Quantification of fold-change in protein expression normalized to GAPDH from 3 different experiments was analyzed by National Institutes of Health Image J densitometry analysis software. Data shown are from a representative experiment and repeated at least 3 additional times with similar results.

