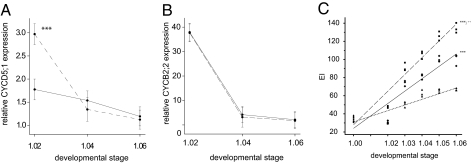
Fig. 3.
Progression of relative (A) CYCD5;1 and (B) CYCB2;2 expression through first leaf pair development in Col-0 and Kas-2. Mean values ± SE (n = 3) (y axis) for first leaf pair of Col-0 (solid line) and Kas-2 (dashed line) sampled at a series of leaf developmental stages (x axis). ***P < 0.001 pairwise contrast tested after ANOVA. The developmental stages are shown along the x axis. (C) Endoreduplication levels through first leaf pair development in an amiRNA line (▲), Col-0 (◆), and Kas-2 (■). A simple linear regression model was fitted for each genotype (amiRNA line: dotted line; Col-0: solid line; and Kas-2: long dash line). An analysis of parallelism was performed to test for differences: *P < 0.05; **P < 0.01; ***P < 0.001 (compared with the amiRNA-CYCD5;1 line using Student t test); ++P < 0.01 (compared with Col-0 using Student t test).

