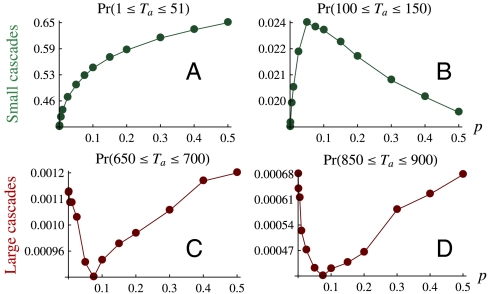
Fig. 6.
(A) Networks mitigating the smallest cascades 1 ≤ Ta ≤ 51 seek isolation p = 0, whereas (B) networks suppressing intermediate cascades 100 ≤ Ta ≤ 150 seek isolation p = 0 or strong coupling p = 1, depending on the initial interconnectivity p in relation to the unstable critical point p∗ ≈ 0.05. But networks like power grids mitigating large cascades (C and D) would seek interconnectivity at the stable equilibrium p∗ ≈ 0.075 ± 0.01. The bottom figures and the location of p∗ are robust to changes in the window ℓ ≤ Ta ≤ ℓ + 50 for all 400 ≤ ℓ ≤ 1,500.

