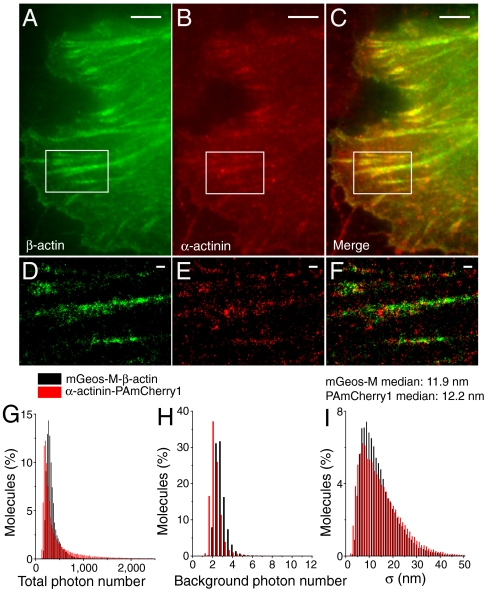
Fig. 4.
Nanostructural distribution analyses of β-actin and α-actinin using two-color (F)PALM/STORM in HeLa cell. (A, B) TIRF images of mGeos-M-β-actin (Green) and PAmCherry1-α-actinin (Red). (C) Merged dual-color TIRF image, diffraction-limited. (D, E) (F)PALM/STORM images of mGeos-M-β-actin (Green) and PAmCherry1-α-actinin (Red), magnified from box in (A) and (B). (F) Merged image of mGeos-M-β-actin (Green) and PAmCherry1-α-actinin (Red). Scale bars: 2 μm in (A)–(C); 500 nm in (D)–(E). (G)–(I) Distribution analysis of total photon number per molecule, background photon number and position precision of mGeos-M-β-actin and α-actinin-PAmCherry1 coexpressed in HeLa cells.

