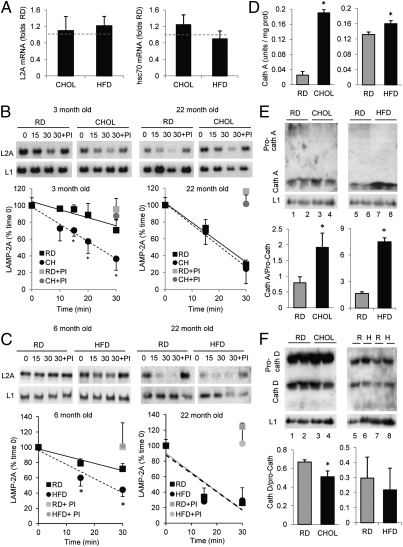
Fig. 3.
Mechanisms of lipid-mediated decrease in LAMP-2A levels. (A) Changes in levels of LAMP-2A (Left) and hsc70 (Right) mRNA in livers of animals subjected to the CHOL or HFD, determined by quantitative real-time PCR assay. Values were corrected for actin in each sample and are expressed relative to the RD. Stability of LAMP-2A in lysosomes isolated from 3- and 22-mo-old animals maintained on the RD and CHOL (CH) (B) and from 6- and 22-mo-old animals maintained on the HFD (C). Lysosomes were incubated at 37 °C in isotonic medium in the presence or lack of a protease inhibitor (PI) and pelleted at the indicated times, and were then subjected to SDS/PAGE and immunoblotting for LAMP-2A (L2A) or LAMP-1 (L1). (Upper) Representative immunoblots. (Lower) Densitometric quantification of the immunoblots. Values are expressed as the percentage of protein present at time 0 and are the mean ± SEM of four different experiments. Where indicated, protease inhibitors were added during the incubation and lysosomes were collected at 30 min (gray symbols). The two-way ANOVA showed interaction (P < 0.05) between the diet and the incubation time in the young animals but not in the old ones in both the CHOL and HFD. The incubation time was the major source of variation in the old groups. *P < 0.05 compared with the RD group by a Bonferroni posttest. (D) Cathepsin A (Cath A) activity in lysosomal membranes isolated from RD-, CHOL-, and HFD-maintained mice. Values are expressed as units per milligram of protein and are the mean ± SEM of three different experiments. Representative immunoblots and densitometric quantification for cathepsin A (E) and cathepsin D (Cath D) (F) in the same lysosomes as in D are shown. Values are expressed as the ratio of the active lower band vs. the precursor upper band and are the mean ± SEM of four different experiments. *P < 0.05 compared with the RD group. R, RD; H, HFD.

