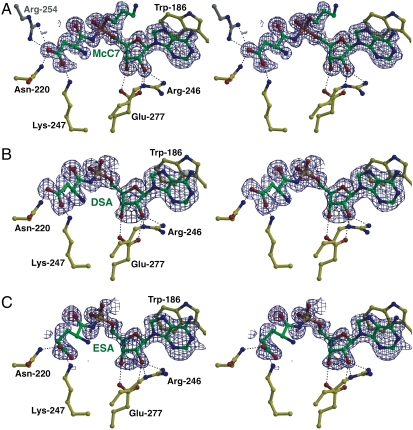
Fig. 3.
Stereoviews of MccF-S118A active site with substrates bound. (A) Stereoview showing the active site features of the MccF-S118A in complex with processed McC7. The MccF carbon atoms are shown in yellow ball-and-stick and the McC7 carbon atoms are colored in green. Superimposed is a difference Fourier electron density map (contoured at 2.7σ over background in blue) calculated with coefficients |Fobs| - |Fcalc| and phases from the final refined model with the coordinates of McC7 deleted prior to one round of refinement. (B) Stereoview showing the active site features of the MccF-S118A in complex with DSA. Superimposed is a difference Fourier electron density map (contoured at 2.5σ) calculated as above. (C) Stereoview showing the active site features of the MccF-S118A in complex with ESA. Superimposed is a difference Fourier electron density map (contoured at 2.5σ over background) calculated as above.

