Fig. 5.
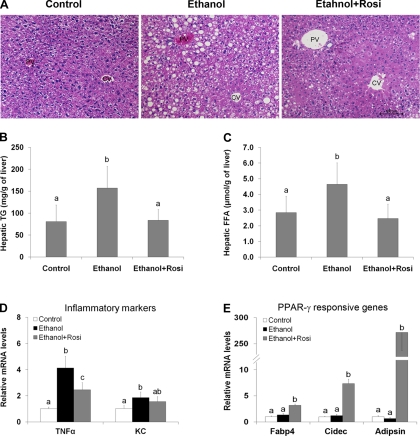
Rosiglitazone reversed ethanol-induced lipid accumulation in the liver. Mice were fed ethanol liquid diet for 8 wk, and rosiglitazone was supplemented in the liquid diet at 10 mg·kg body wt−1·day−1 for the last 3 wk. A: liver histopathology. Hematoxylin and eosin staining. CV, central vein; PV, portal vein. B: hepatic triglyceride (TG) content. C: Hepatic FFA content. D: gene expression of inflammatory cytokines TNF-α and KC in the liver by qRT-PCR. E: expression of PPAR-γ responsive genes in the liver by qRT-PCR. Data are expressed as means ± SD; n = 6–8 in A–C; n = 4 in D and E. Means without a common letter differ at P < 0.05. In D, means of TNF-α gene expression differ at P < 0.01; means of KC gene expression differ at P < 0.05. In E, means without a common letter differ at P < 0.001.

