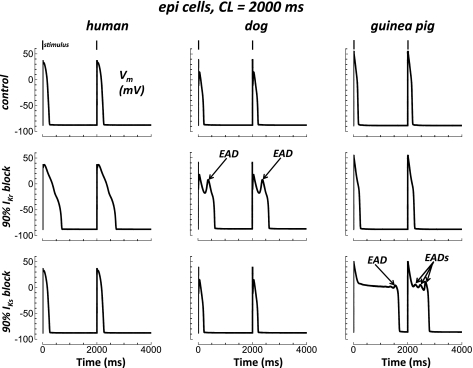
Fig. 7.
Species dependence of EADs. Epi cells were paced at CL = 2,000 ms (final 2 beats shown). Columns show results for human, dog, and guinea pig from left to right. Rows show control, 90% IKr block, and 90% IKs block from top to bottom. Stimuli are indicated along the top. EADs are labeled with arrows.

