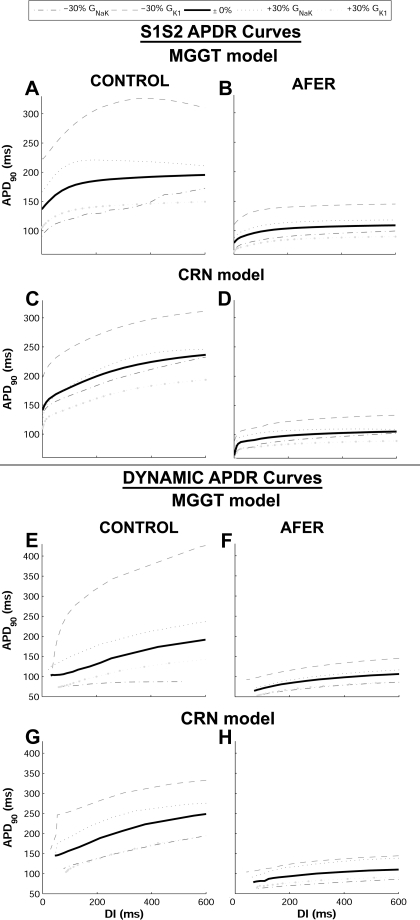
Fig. 2.
AP duration (APD) restitution (APDR) curves obtained using the S1S2 (top, A–D) and dynamic (bottom, E–H) protocols, in control (left) and AFER conditions (right) with the MGGT and the CRN models for default values and following ±30% alterations in Na+/K+ pump current conductance (GNaK) and conductance of inward rectifier potassium current (GK1).

