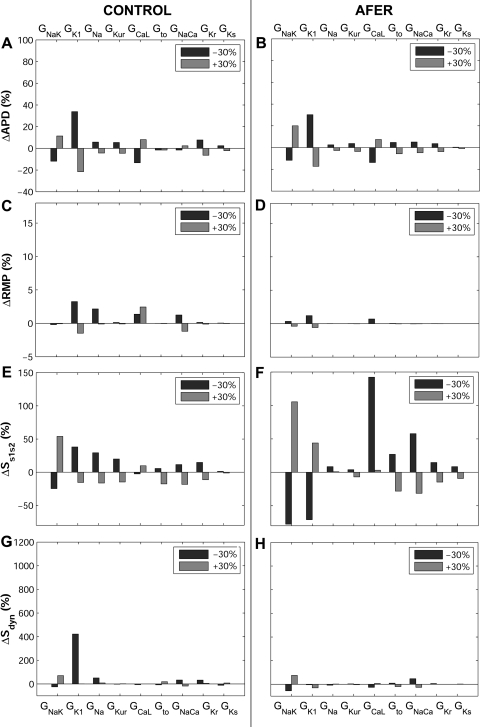
Fig. 5.
Percent changes in steady-state APD90 (ΔAPD90; A and B), RMP (ΔRMP; C and D), and Ss1s2 (ΔSs1s2; E and F) and Sdyn (ΔSdyn; G and H) (maximal values of the slopes of the S1S2 and dynamic APD90) with respect to default conditions produced by ±30% alterations in ionic conductances for control (left) and AFER (right) with the CRN model.

