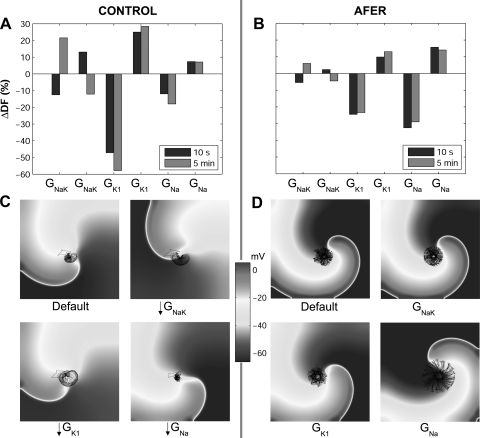
Fig. 8.
Percent changes in dominant frequency (ΔDF) with respect to default conditions produced by ±30% alterations in GNaK, GK1, and GNa in control (A) and AFER (B) using the MGGT model. DF values are shown for reentry initiated at 10 s (blue bars) and 5 min (red bars) following changes in ionic parameters. Snapshots of reentry 10 s after the change in ionic parameters under default conditions and 30% block of GNaK, GK1, and GNa in control (C) and AFER (D). Black lines on snapshots represent the corresponding phase singularities (PS) trajectories.

