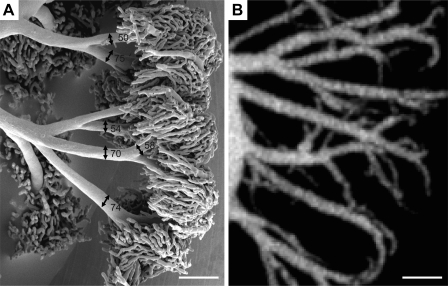
Fig. 1.
Vessel diameters at the arteriole to capillary transition zone. A: scanning electron microscopy image of an embryonic day (E)13.5 CD1 placenta selectively perfused to fill only the arterial vessels and the transition into capillaries. Vessel diameters are shown in micrometers. The arteriole vessels that branch into capillary tufts in this representative image range from 50 to 75 μm in diameter. B: maximum intensity projection image of an E13.5 CD1 placenta imaged with microcomputed tomography. Scale bars in A and B = 200 μm.

