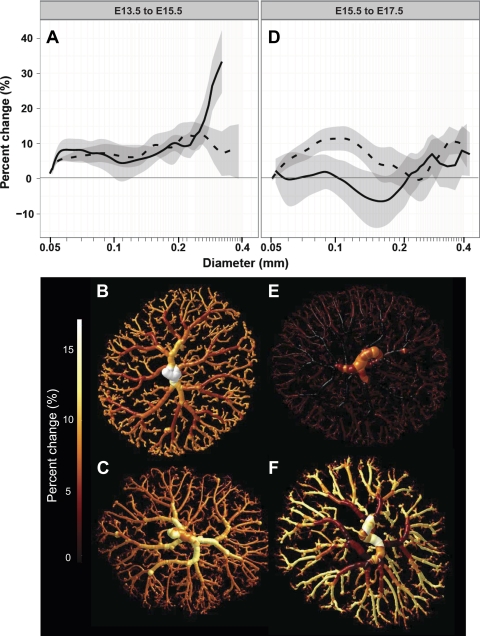
Fig. 7.
Growth modeling in CD1 (solid line) and B6 (dashed line) placentas. A: percent change in diameter from E13.5 to E15.5 plotted against vessel diameter. ANOVA revealed that the percent change in diameter of the chorionic plate-sized arteries differed significantly between strains. B and C: isosurfaces color rendered to show the percent enlargement in an example CD1 (B) and B6 (C) tree over this time period. D: ANOVA revealed that the percent enlargement of the arteriole and intraplacental artery-sized vessels from E15.5 to E17.5 differed between strains. E and F: iso-surface color renderings showing little to no increase in CD1 trees (E) and significant enlargement in B6 trees (F). Data are shown as mean ± 95% confidence interval; n = 7–10 placental specimens/group (including ≥4 dams/group and 1–3 specimens/litter).

