Fig. 8.
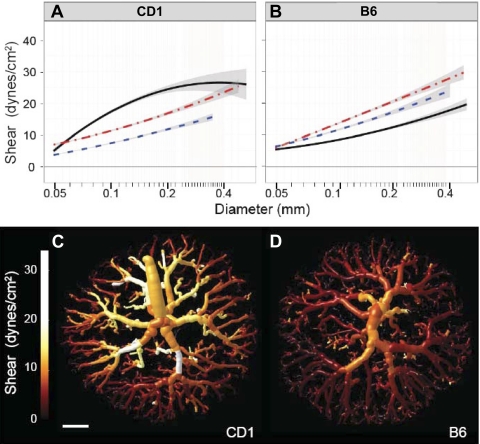
Shear stress during late gestation. A and B: distribution of shear in fetoplacental arterial tree CD1 (A) and B6 (B) placentas at E13.5 (blue dotted line), E15.5 (red dashed-dotted line), and E17.5 (black solid line). Data are shown as mean ± 95% confidence intervals of the mean; n = 7–10 placental specimens/group (including ≥4 dams/group and 1–3 specimens/litter). C and D: tubular models color rendered to show shear magnitude at E17.5 in example CD1 (C) and B6 (D) placentas. The CD1 tree demonstrated higher shear throughout. This was most noticeable in the larger vessels, which display more yellow and white coloring compared with the B6 tree. Scale bar = 1 mm.

