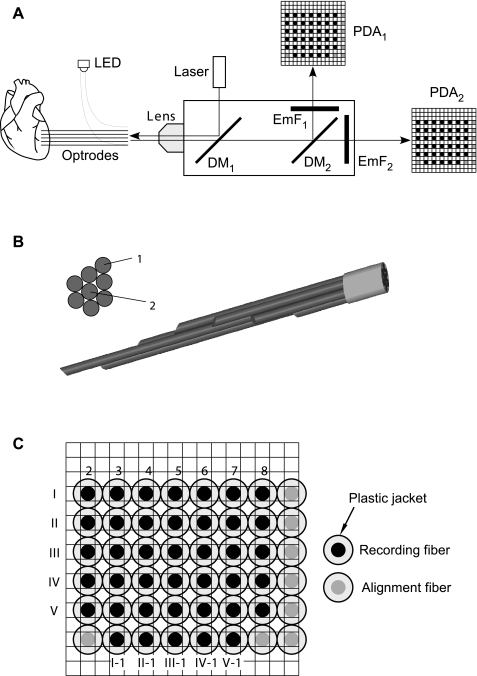
Fig. 1.
A: schematic diagram of the optical system. LED, light-emitting diode; DM1 and DM2, first and second dichroic mirrors, respectively; EmF1, emission filter; PDA1 and PDA2, first and second photodiode arrays, respectively. B: cross-sectional and side views of the of the optrode tissue end. C: view of the detector end of the optrode array overlaid on the PDA mask. Solid circles, recording optical fibers; shaded circles: alignment fibers. Seven intramural recording fibers (fibers 2–8) from each of the five optrodes (optrodes I–V) were arranged in rows. Five epicardial recording fibers (fibers I-1 to V-1) were arranged in another row.

