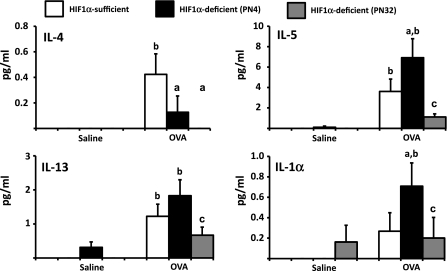
Fig. 7.
The effect of OVA on cytokine levels. Cytokine levels in BALF were determined using a Th1/Th2 bead array panel (BD Bioscience). Samples were collected from HIF-1α-sufficient (white bars), PN4 HIF-1α-deficient (black bars), and PN32 HIF-1α-deficient (gray bars) mice sensitized/challenged with saline or with OVA. Data is represented as means ± SE (n ≥ 9). a, Significantly different from HIF-1α-sufficient within treatment, P < 0.05; b, significantly different from saline treatment within genotype, P < 0.05; c, significantly different from PN4 HIF-1α-deficient within treatment, P < 0.05.

