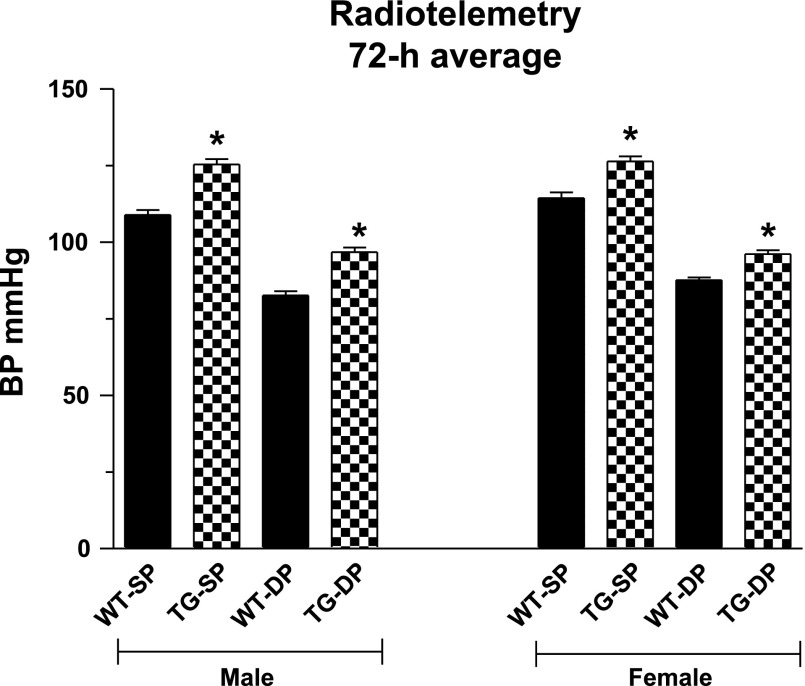
Fig. 2.
Enhanced cyan fluorescent protein (ECFP)/ANG II (line A mice) transgenic mice exhibit increased average (day and night) blood pressures compared with wild-type littermates by radiotelemetry. Bars represent averages over a 72-h data collection period (30 s every 30 min). WT, wild-type; TG, transgenic; SP, systolic pressure; DP, diastolic pressure. Values are expressed as means ± SE; n = 9 for all groups. *P < 0.001 for TG vs. corresponding WT (unpaired t-test).

